Special education data shows improvement in graduation rate and fourth grade literacy
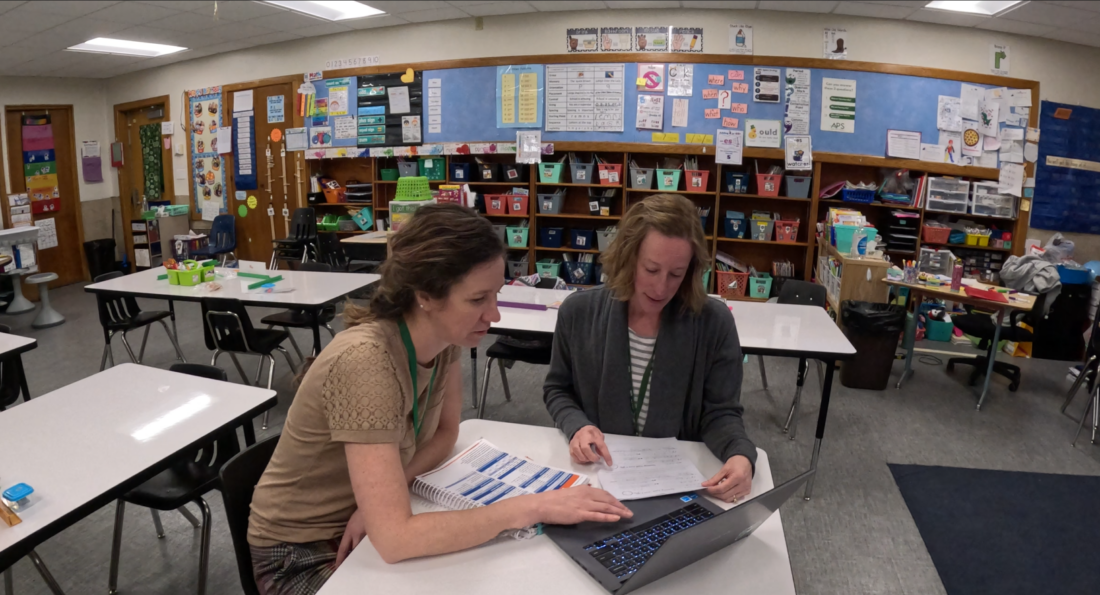
Courtesy Photo Ella White Elementary First Grade Teacher Lori Stoen (left) and AMA ESD Instructional Coach Tina DenBleyker (right) review student literacy data together.
ALPENA — Recently released statistics from the Individuals with Disabilities Education Act (IDEA) 2026 public reporting data shows a number of improvements in special education in school districts in the Alpena-Montmorency-Alcona Educational Service District (AMA ESD).
The report shows the goals that went met or unmet in 14 indicator categories. The categories give a general picture of the impact of special education across school districts and educational service districts in Michigan.
The AMA ESD oversees special education services across four public school districts: Alpena Public Schools, Atlanta Community Schools, Hillman Community Schools, and Alcona Community Schools.
Indicator one looks at the graduation rate of students with Individualized Education Programs (IEPs) that graduated from high school with a regular diploma. The target to meet for the 2024-2025 school year is greater than or equal to 72.30%. Statewide, the goal was not met with a graduation rate of 68.42%. Across the AMA ESD, the graduation rate was 57.89%, a slight improvement from 56.14% in 2023-2024.
Some students with IEPs receive a certificate of completion over a regular high school diploma, for instance, the students that graduate from Pied Piper School.
Pied Piper is a special education school for students with a variety of learning, cognitive, and/or physical disabilities.
AMA ESD Superintendent Justin Gluesing said that students at Pied Piper are tested through MI-Access, which is Michigan’s alternate assessment system and is designed for students with the most significant cognitive disabilities, and whose IEP team has determined that general assessments, even with accommodations, are not appropriate. MI-Access satisfies the federal requirement that all students with disabilities be assessed at the state level.
Graduation of Pied Piper students from the transition program, which is for 18-26 year olds, is determined through collaboration with the student, the family, the school, and the IEP team about the student’s readiness to transition from AMA ESD’s services into the real world, so to speak, which looks different for every student.
“It can vary significantly in terms of when they decide it’s the right moment for them to graduate and basically conclude their time with the AM,” Gluesing said. “That’s kind of the program to link them to whatever’s next for them and hopefully give them that opportunity for as much independence as possible.”
Indicator three looks at participation and performance of children with an Individualized Education Program (IEP) on statewide assessments in reading and math.
The AMA ESD had high numbers of participation rates in reading and math assessments across all grade levels in 2024-2025. The statewide target to hit is at least 95% of students participating. A total of 100% of fourth graders participated in both math and reading. The goal was barely missed for high school participation at 94.55% for both math and reading. Participation for eighth grade was at 96.15%.
The goals for proficiency rates for students on assessments using alternate academic achievement standards were not met at the state level. High school students in the AMA ESD met the goal for reading with 75%. The target is 73.1%,
Fourth grade students in the AMA ESD that took the assessment were close to meeting the goal for reading with a 60% proficiency rate. The target for them is 62.5%. The 60% figure is an improvement from the 2023-2024 school year where proficiency was 33.33% using alternate standards.
“We know we have challenges in the literacy space across the spectrum of gen ed to special ed,” Gluesing said.
There has been an additional focus made on instruction in the special education area in math, he said.
AMA ESD staff are training in ADD Vantage Math Recovery (AVMR), where participants are actively involved in rich discussions around students’ mathematical thinking, according to a description of AVMR courses. Participants leave the course ready to work with students and
implement new knowledge in their teaching practices to meet the needs of a diverse range of students.
AMA ESD instructional coaches have been helping teachers at APS implement The University of Florida Literacy Institute (UFLI) Foundations program, which uses the science of reading in instruction.
Instructing teachers in UFLI Foundations and AVMR has been aided by a new teacher training model used by AMA ESD, according to a May 29 press release. The model uses a three layered system that emphasizes face-to-face learning and hand-on classroom support by instructional coaches.
The training is translating to measurable student growth, where early benchmark data shows kindergarten and first-grade classrooms in Alpena and Atlanta progressing between fall and winter assessments. Among students tested, 50% of kindergarten students advanced by one reading level or more along with 41% of first grade students.
Another data point in the IDEA public reporting data shows the percent of ESDs that have a significant discrepancy, as defined by the State, in the rate of suspensions and expulsions of greater than 10 days in a school year for children with an IEP. Michigan defines significant discrepancy as more than 5% of an ESD’s students with an IEP suspended/expelled greater than 10 days.
The statewide goal is less than or equal to 3.51% in 2024-2025. The AMA ESD met that goal with 2.3%.
Indicator five shows the percentage of special education students inside a regular classroom for 80% or more of the day, less than 40% of the day, or in a separate facility altogether.
58.06% of students are in a regular classroom for 80% or more of the day in the AMA ESD, 14.42% are in a regular classroom for less than 40% of the day, and 6.01% are in a separate facility.
The statewide goals for each of those factors respectively is 70.50% or more, 9.65% or less, and 4.96% or less.
While data can show something of the impact of special education, it does not paint the full picture of student outcomes.
“A student’s outcomes, if we resign them to a spreadsheet, it’s like the worst way to try to look at a student’s potential,” Gluesing said. “Every student has such a diverse opportunity and diverse pathways that they might select that aren’t reflected in the data.”
To see more of the IDEA public reporting data for 2024-2025, visit https://mischooldata.org/new-indicator-report-summary/.
Local News
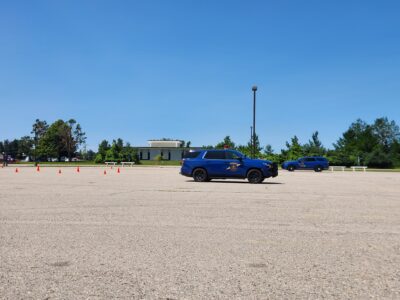
Alpena Community College hosts Law Enforcement Career Academy
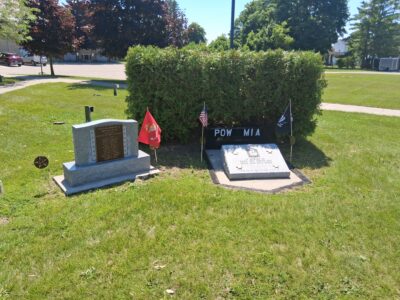
Purple Heart Day Ceremony planned at Veterans Park
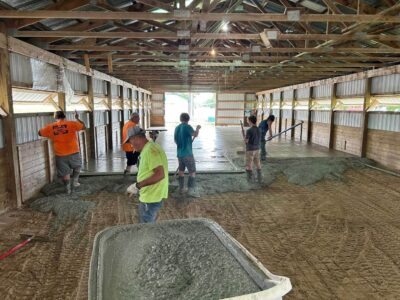
Getting ready for the fair
Habitat for Humanity to host pickleball tournament fundraiser
Circuit Court to consider implementing seasonal lake levels on Grand Lake
PRESQUE ISLE – On August 10, 2026, the Presque Isle County Circuit Court will hold a hearing to establish ...